DEFINITION OF PROCESS
An instance of a program is called a Process. In simple terms, any command that you give to your Linux machine starts a new process. The process that run first in Linux is init.
After the Linux kernel has booted, the init program reads the /etc/inittab file to determine the behavior for each runlevel. Unless the user specifies another value as a kernel boot parameter, the system will attempt to enter (start) the default runlevel.
TYPES OF PROCESS
- Foreground is process that run in the screen and need input from the user (interactive).
- Background is process that run in the background and usually do not need user input.
- Batch is process that collected and executed sequentially (one by one) (not associated/interacting with the terminal).
- Daemon is process that waits for requests from other processes and performs tasks according to requests. If there is no request, the program will be idle and not use the CPU at all. Generally the name of the daemon process on UNIX ends with d for example inetd, named, popd etc.
PROCESS OPERATIONS
- Create a process.
- Destroy a process.
- Suspend a process.
- Resume a process.
- Blocking a process.
- Wake up the process.
- Schedule a process.
IDENTIFY PROCESS LIST
USE PS COMMAND
$ ps auxf                                   #   detailed of all process
$ ps -eLf                                   #   showing ppid of process
$ ps -u root -u root u                      #   grep by username
$ ps -eo pid,cpu,pmem,stat,start,comm       #   filter column
$ ps auxf --sort=pmem/pcpu                  #   sort by cpu or memory usage
$ ps -eo pid,comm,etime                     #   filter column with elapsed time
VSZ (Virtual Memory Size). It includes all memory that the process can access, including memory that is swapped out, memory that is allocated, but not used, and memory that is from shared libraries. RSS (Resident Set Size) the non-swapped physical memory that a task has used (how much memory is allocated to that process in kiloBytes). PPID (Parent Process ID) LWP (Light Weight Process) thread ID of the dispatchable entity (alias spid, tid) NLWP (Number of LWP) threads in the process
USE TOP COMMAND

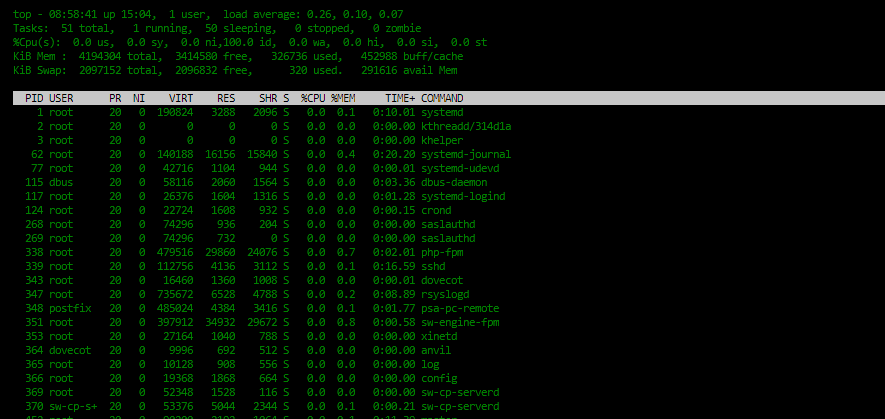
top - 09:21:34 up 15:27, 1 user, load average: 0.07, 0.06, 0.05
- system time
- uptime
- user sessions
- load average is the amount of traffic to your CPU(s) over the past 1, 5, and 15 minutes-
- generally you want this number to be below the number of CPU(s)/cores you have.
- 1.0 on a single core machine means it's using the CPU to it's maximum-
- and anything above that means things are getting queued. Some interpretations:

If the averages are 0.0, then your system is idle.
If the 1minute >= 5 or 15minute averages, then load is increasing.
If the 1minute <= 5 or 15minute averages, then load is decreasing.
If they are higher than your CPU count, then you might have a performance problem.

http://blog.scoutapp.com/articles/2009/07/31/understanding-load-averages .
Tasks: 50 total, 1 running, 49 sleeping, 0 stopped, 0 zombie
- D - uninterruptible sleep: a sleep state where the process is waiting for something to happen.
      It cannot be interrupted by a signal; it is usually seen when the process is waiting for the disk.
- R - running: the process is ready to run, and will run whenever its turn to use the CPU comes
- S - sleeping: a sleep state where the process is waiting for something to happen.
- T - traced or stopped: it is a state where the process is stopped, usually via SIGSTOP or SIGTSTP.
      It can also be stopped by a debugger (ptrace). When you see that state,
      it is usually because you used Ctrl-Z to put a command in the background.
- Z - zombie: is a state where the process is dead (it has finished its execution)
      and the only thing left is the structure describing it on the kernel.
      It is waiting for its parent process to retrieve its exit code, and not much more.
      After its parent process is finished with it, it will disappear.
%Cpu(s): 0.3 us, 0.0 sy, 0.0 ni, 99.7 id, 0.0 wa, 0.0 hi, 0.0 si, 0.0 st
- us (user) : time spent running user processes that haven’t had their priority changed with the nice command
- sy (system) : time spent on running kernelspace processes
- ni (nice) : nice value range is -20 to +19 where -20 is highest, 0 default and +19 is lowest.
- lower nice values mean higher priority. The relation between nice value and priority is PR = 20 + NI
- id : time the CPU remains idle
- wa : time the CPU spends waiting for I/O to complete
- hi/si : time spent on handling hardware and software interrupt
- st : time taken from this virtual machine by the hypervisor
KiB Mem : 4194304 total, 3446756 free, 327864 used, 419684 buff/cache
KiB Swap: 2097152 total, 2096832 free, 320 used. 306640 avail Mem
- Detailed of memory and swap usage in KiB=1024bytes
- buff/cache is the total of memory that used to maintain disk writes.
- avail mem value is the amount of memory that can be allocated to processes w/h causing more swapping.
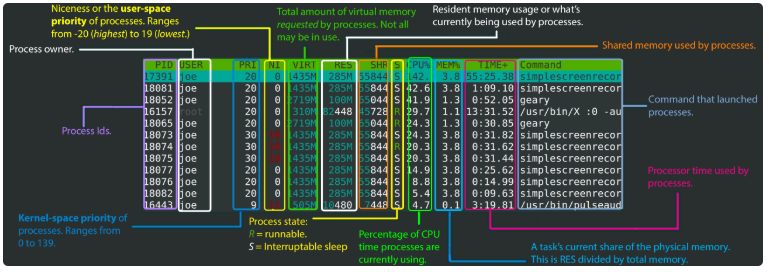
PID USER PR NI VIRT RES SHR S %CPU %MEM TIME+ COMMAND
- PR    : priority (20 for highest and -20 for lowest)
- NI    : the nice value of task
- VIRT  : virtual memory used (kb)
- RES   : physical memory used (kb)
- SHR   : shared memory used (kb)
- S     : status of process
- TIME+ : total cpu time used by the task
h or ? # help
f + select field (space) # add/remove field
l,t,m # l-load avg, t-task/cpu stats, m-memory info
shift + c # show position/coordinate of cursor
shift + m # sort by memory usage
shift + p # sort by cpu usage
shift + l + [string] # find string
s + [second] # change delay time of refresh
E # change memory section to MiB
c # show the command path
V # display the processes in a parent-child hierarchy
top -p [pid-process] # monitor only specific pid
top -u [user] # monitor only specific user
top -b # display top in batch mode
top + select pid+ k + enter + 9 # kill process
top + shift + m + x # change the highlight to the current sort
top + t + 1 # separate cpu core stateUSE HTOP COMMAND


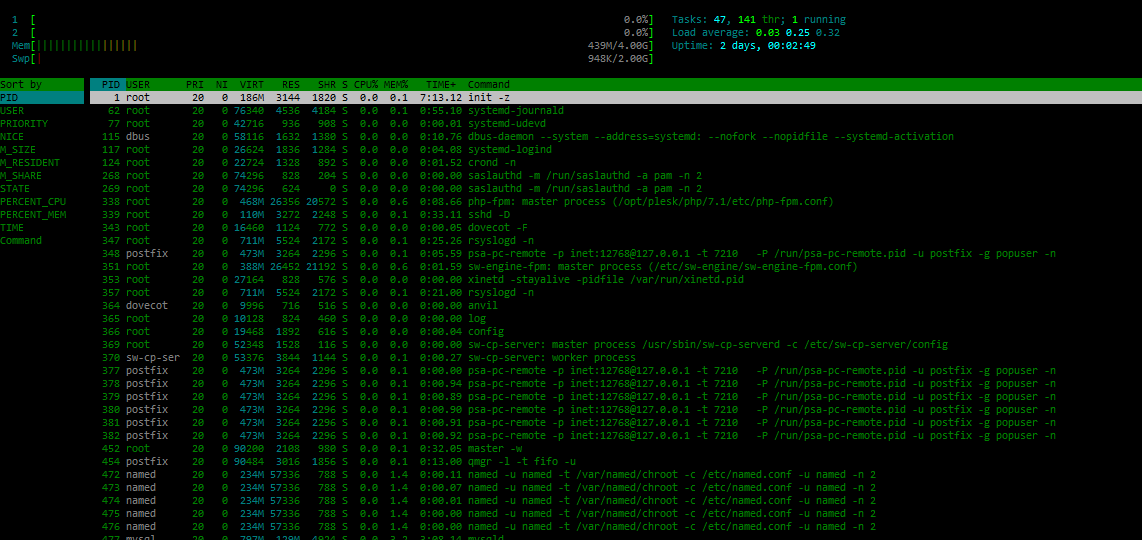
< + [select column]                 # change sort order based on a column
u + [select user]                   # display process only specific user
select process + k + send signal    # kill a process
select process + s                  # run strace
select process + l                  # run lsof
M/P/T                               # change sort order by memory, processor or time
I                                   # invert sort
KILL PROCESS
- Find pid of process running by specific user
pgrep -u [username] [process-name] - Find pid of process
pidof [process-name] - Find pid of processes
pgrep -l [process-name] - Kill process
kill -9 [pid-of-process] - Knowing detail of signal number
kill -l - Kill processes by name
killall [process-name]orpkill [process-name]
PRIORITY OF PROCESS
There are a total of 140 priorities and two distinct priority ranges implemented in Linux. The first one is nice value (niceness) which ranges from -20 (highest priority value) to 19 (lowest priority value) and the default is 0. The other is the real-time priority, which ranges from 1 to 99 by default, then 100 to 139 are meant for user-space.
NI – is the nice value, which is a user-space concept PR or PRI – is the process’s actual priority, as seen by the Linux kernel.
Nice concept :
- If no value is provided, nice sets a priority of 10 by default.
- A command or program run without nice defaults to a priority of zero.
- Only root can run a command or program with increased or high priority.
- Normal users can only run a command or program with low priority.
- View nice value of process
ps -eo pid,ni,commortoporhtop - Start process with nice value
nice -n [value] [command/process-name] - Change priority of process
renice -n -12 -p [pid-of-process]orrenice -n -2 -u [user]
SENT PROCESS TO BACKGROUND
$ watch -n1 ls -larth
$ ctrl + z
$ [1]+  Stopped watch -n1 ls

$ jobs
$ [1]+  Stopped watch -n1 ls

$ bg
PROC directory
/proc/pid/
- cmdline – command line of the process
- environ – environmental variables
- fd – file descriptors
LSOF (List of open files)
lsof -u username lsof -u ^exclude-username lsof -p pid-of-process lsof -c process-name lsof -t -u username lsof -u username -c process-name lsof -i = list all network connections lsof -i -u username = list all network files in use by specific username lsof -i -c process-name = list all network files in use by specific process lsof -i :[port] = list all network files on a particular port lsof -i tcp/udp = list all network files on a particular protokol
