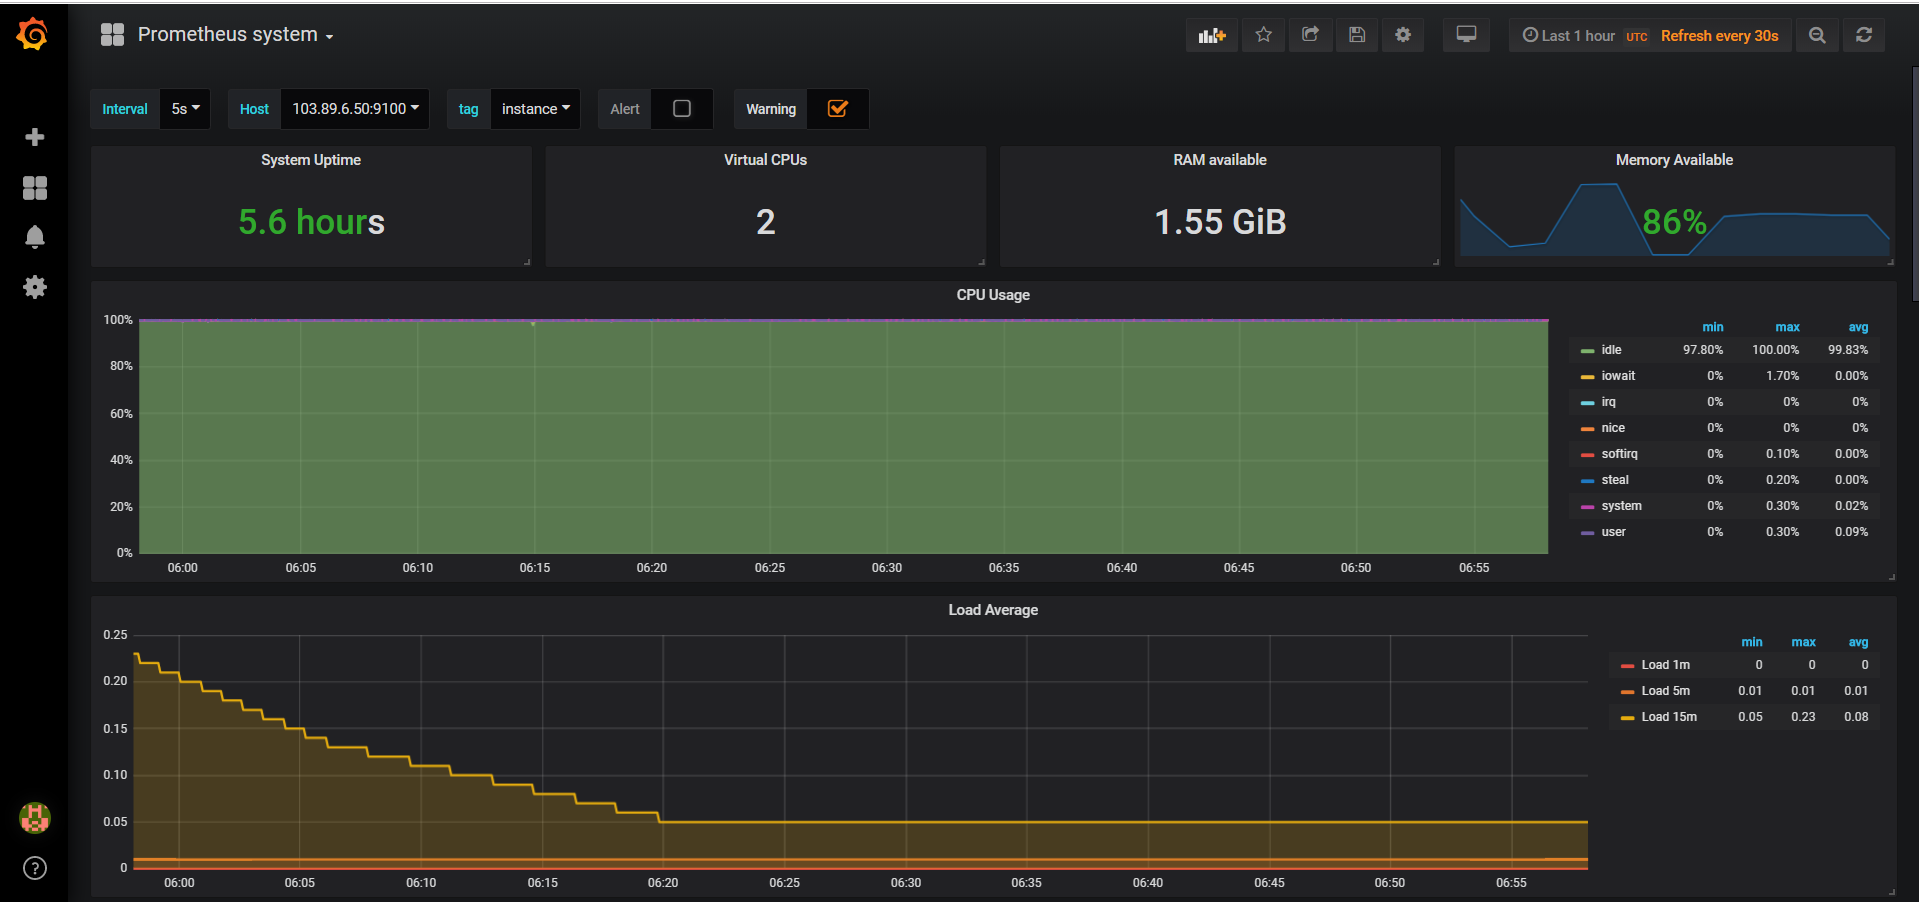
Monitoring Instance with Prometheus and Grafana
Prometheus section
- Login to the server with root access.
- Update and upgrade system : yum -y update; yum -y upgrade
- Download and Install Prometheus :
- [root@prometheus]# wget https://github.com/prometheus/prometheus/releases/download/v2.9.2/prometheus-2.9.2.linux-amd64.tar.gz
- [root@prometheus]# tar xvfz prometheus-2.92.linux-amd64.tar.gz
- [root@prometheus]# mv prometheus-2.92.linux-amd64 prometheus
- [root@prometheus]# cd prometheus
- [root@prometheus]# cat prometheus.yaml #basic configuration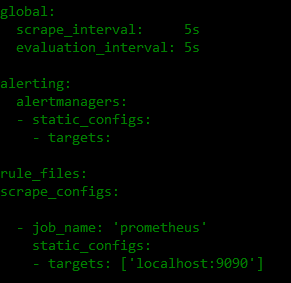
- Start prometheus service : ./prometheus --config.file=prometheus.yml
- Open firewall tcp port 9090
Client Section, monitoring other Linux machine
-
Login to the client machine
-
Download, extract, and running the node exporter
[root@client]# wget https://github.com/prometheus/node_exporter/releases/download/v0.17.0/node_exporter-0.17.0.linux-amd64.tar.gz [root@client]# tar xzvf node_exporter-0.17.0.linux-amd64.tar.gz [root@client]# mv node_exporter-0.17.0.linux-amd64.tar.gz node_exporter [root@client]# cd node_exporter [root@client]# ./node_exporter -
Set node_exporter as a service
#reference : https://devopscube.com/monitor-linux-servers-prometheus-node-exporter/
[root@client]# cp node_exporter /usr/local/bin
[root@client]# useradd -rs /bin/false node_exporter
[root@client]# cat > /etc/systemd/system/node_exporter.service
[Unit] Description=Node Exporter After=network.target [Service] User=node_exporter Group=node_exporter Type=simple ExecStart=/usr/local/bin/node_exporter [Install] WantedBy=multi-user.target
-
Start daemon, node_exporter and enable autostart
[root@client]# systemctl daemon-reload [root@client]# systemctl start node_exporter [root@client]# systemctl status node_exporter [root@client]# systemctl enable node_exporter -
Open firewall port 9100
-
Make sure you can access node exporter metric via http://
:9100/metrics
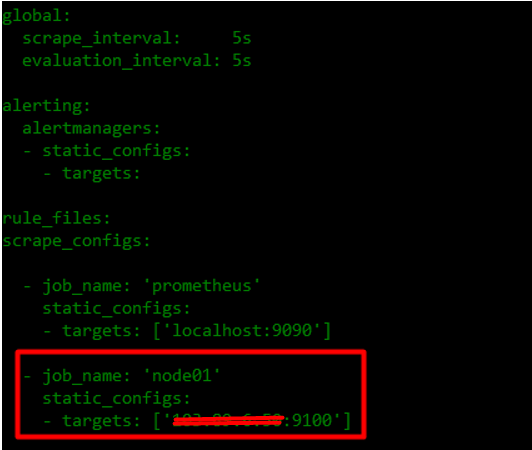
Prometheus section 2.0
- Login to the server with root access.
- CD to Prometheus directory
- Re-configure prometheus.yaml, add client scrape_configs
- Restart Prometheus service : ./prometheus --config.file=prometheus.yml
- Send Prometheus service to the background : ctrl +z and then bg
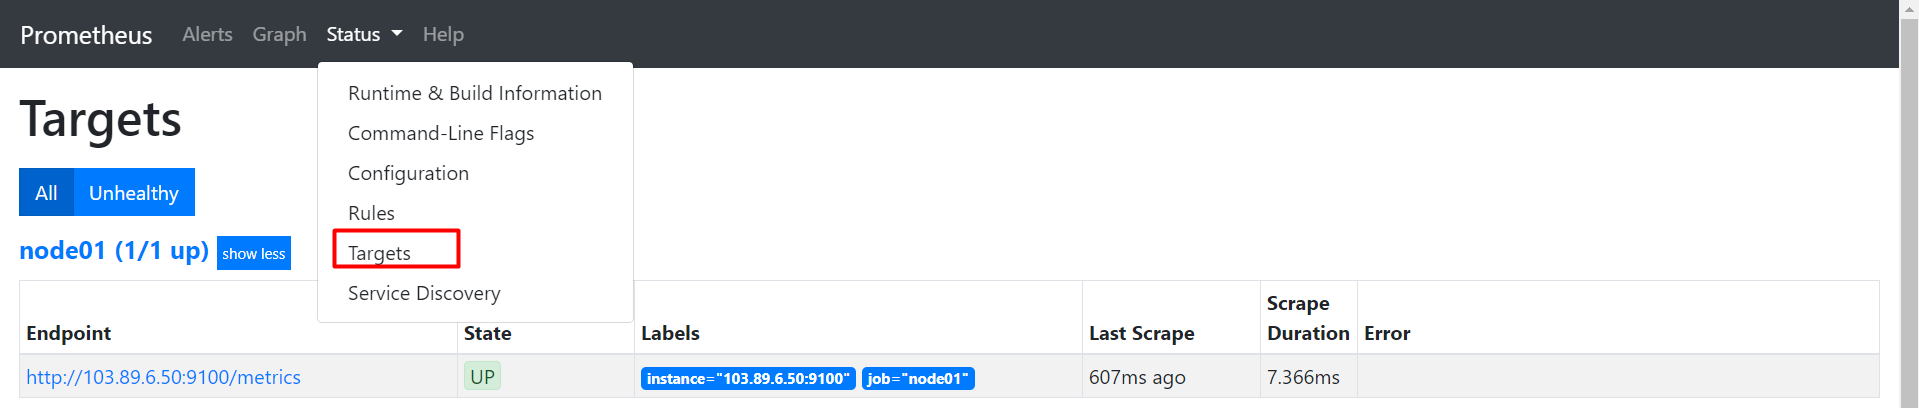
- Make sure client node_exporter status is active on Prometheus > Status > Targets
Grafana section (same server with prometheus)
- Login to the machine with root access
- Install grafana with yum : yum install https://dl.grafana.com/oss/release/grafana-5.4.2-1.x86_64.rpm
- Start grafana service
[root@prometheus]# systemctl start grafana-server [root@prometheus]# systemctl enable grafana-server - Open firewall tcp port 3000
- Access Grafana dashboard on the browser : http://ip-address:3000
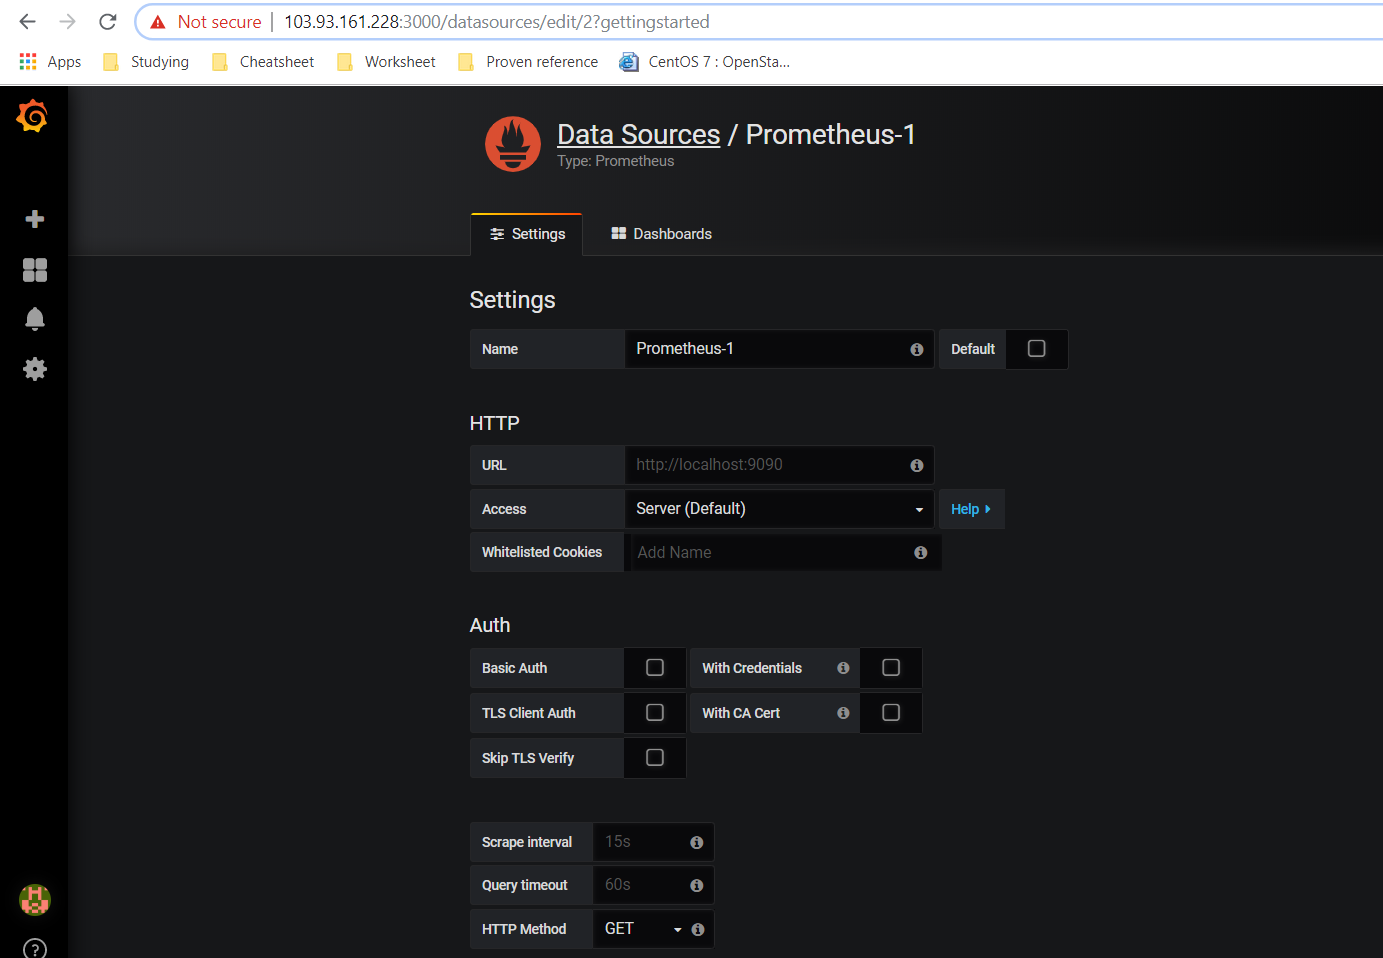
- Create Prometheus datasource (https://prometheus.io/docs/visualization/grafana/)
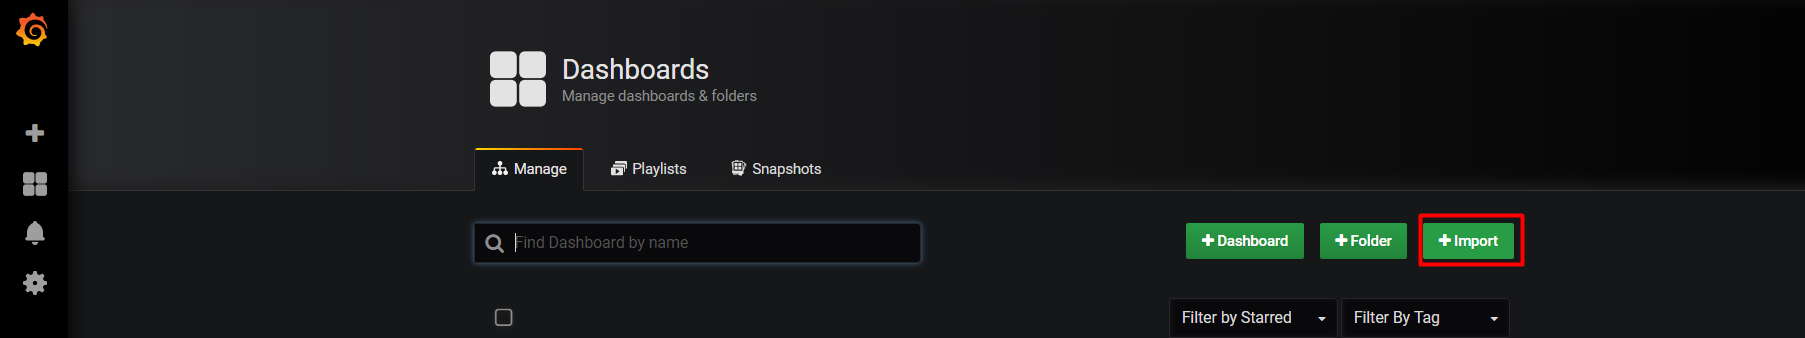
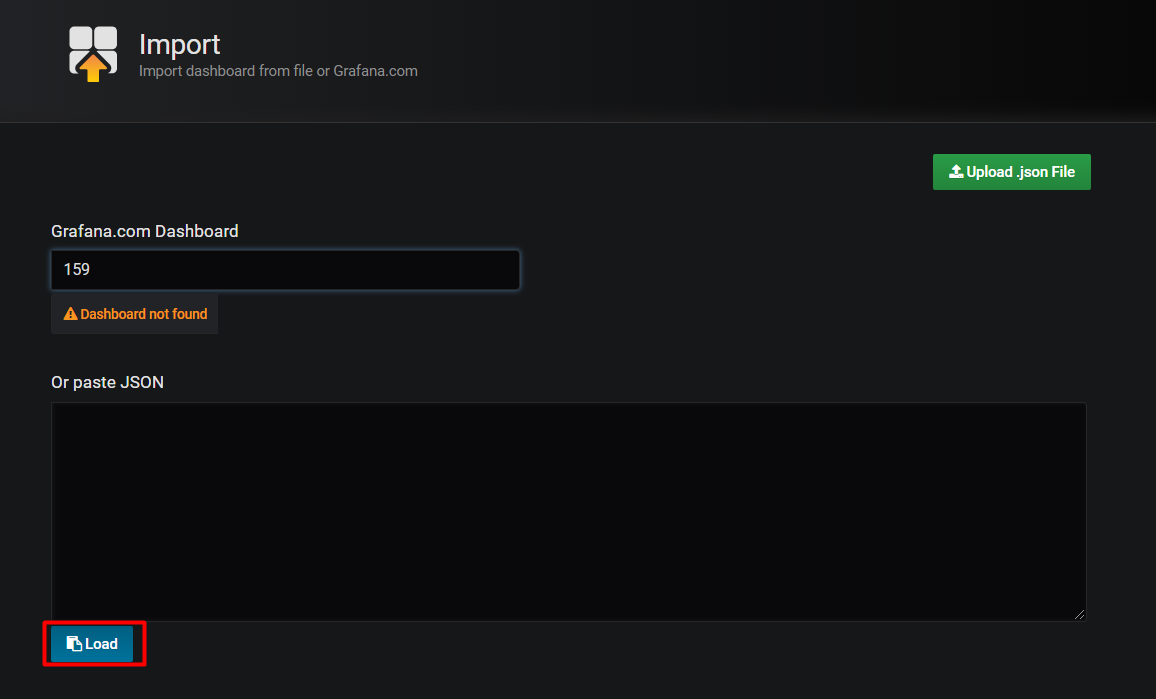
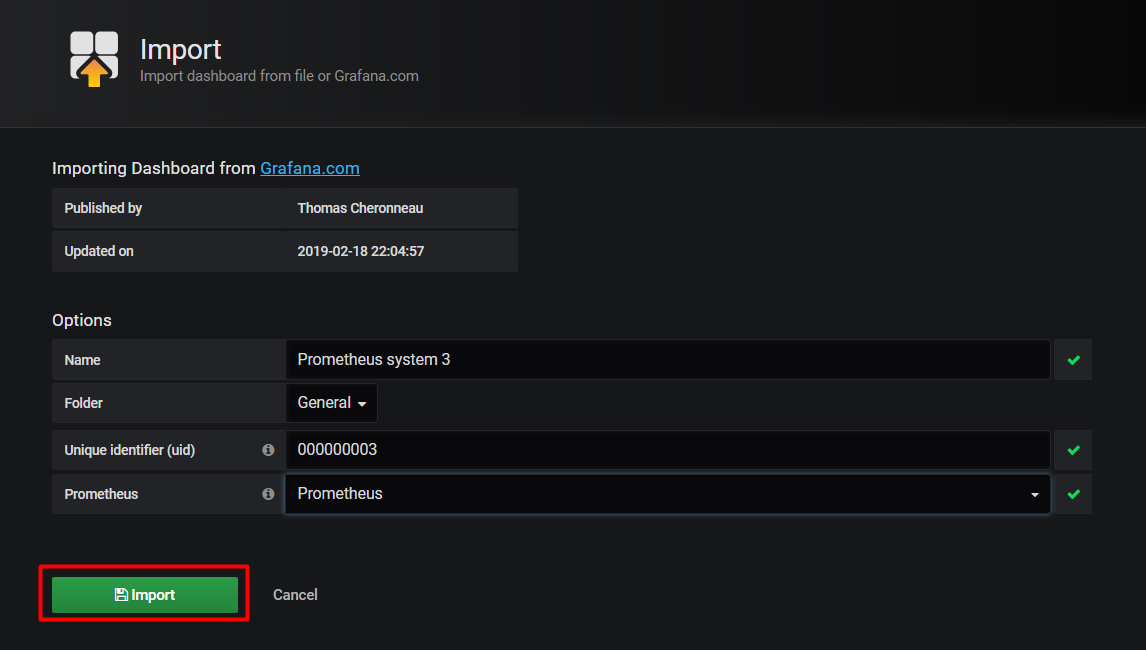
- Import dashboard template for monitoring linux machine with Prometheus, you can download the json file from this url : https://grafana.com/dashboards/159